AI Supercycle

In the early 2000s, after the dotcom-bubble popped, there was much talk about a commodity ‘supercycle’. China had just entered the WTO and embarked upon a fiscal policy of massive industrialization. This led to shortages in several key commodities from iron ore and copper to oil and gas, which were further compounded as countries began stockpiling resources in response. The resultant spike in commodity prices sent the shares of resource stocks soaring (mining companies, oil producers, etc.).

But these businesses are highly cyclical: They’re prone to boom/bust cycles. This is because of the unpredictability of demand and the difficulty of adjusting supply. Building new mining capacity takes years and requires heavy capital investment. Supply/demand shocks take time to work their way through the system. As a result, resource companies make huge profits during boom times. Seeking to capitalize, they invest heavily in new supply. But overinvestment on the supply side, especially when combined with unforeseen demand weakness, can lead to oversupply, triggering heavy losses and, in severe cases, major busts.

Cycles like these can vary in duration and magnitude. Typically, the longer and steeper the up-cycle, the more severe the down-cycle. This is where talk of a ‘supercycle’ – a never-ending up-cycle – becomes especially dangerous.

China’s entry to the WTO heralded an era of unprecedented demand. The sleeping giant of the world economy had finally woken up. So great was the scope for China’s industrialization (not to mention the rest of the BRICs) that demand would exceed supply for decades to come. A commodity supercycle had begun, breaking the paradigm of normal cyclicality. At least, that was the story. Resource stocks were being priced as though the boom would never end. But it did end, much sooner than expected, and the losses were significant. The China story failed to live up to the hype, just as the dotcom bubble before it had also done, not to mention a multitude of other speculative manias before that. Boom-bust cycles aren’t limited to commodities.

This is relevant to us today because the current AI trade bears eery similarity to the commodity supercycle. Big tech is the new China, datacentres the new industrialization, and chipmakers the new resource companies. Like mining companies, chipmakers are highly cyclical, frequently swinging between profits and losses as the cycle turns. This is especially true for more commoditized chips, like memory chips. These businesses are also highly capital intensive. It takes time and capex for supply to catch up to demand, resulting in chip shortages when there’s a mismatch.

And there’s never been a bigger mismatch than what we see today, particularly in memory chips. Big tech ‘hyperscalers’ are engaged in possibly the biggest capex splurge in the history of the world, competing to build datacentre capacity for their AI models. In many cases they’re paying double or even triple for the hardware they need. This has sent the shares of chipmakers, especially memory chips, skyrocketing. SanDisk is up 50x over the last year. Shares of Micron and SK Hynix have risen 10x, reaching a $1trn market cap almost overnight. The entire 20% year-to-date gain on the Nasdaq 100 index can be attributed to just 10 stocks – all of them chipmakers. The other 90 stocks in the index added up to zero. Today, half of the exclusive Trillion $ Market Cap club are chipmakers. All but two (Eli Lilly and Berkshire Hathaway) are tech companies. We’re looking at an AI supercycle.

The commodity supercycle didn’t come close to this, not in speed nor in magnitude. This is much bigger than China and resources, but the story reads the same: A Bloomberg article covering the US listing of SK Hynix (‘the largest ever public listing by a foreign company is US market history’) was published over the weekend. The headline read, ‘SK Hynix debut is a bet that AI breaks the boom-and-bust chip cycle.’ Indeed it is. These companies are being priced for a never-ending up-cycle, and therein lies the danger.

And what about the hyperscalers racking up $100s of billions in debt to finance all this hardware? One big difference between basic commodities and computer hardware is that the latter depreciates very rapidly… To keep the AI trade going, these hyperscalers need to generate massive, immediate returns on their AI models before their hardware becomes obsolete. The stakes are high and the risk is real.

So where do we go from here? The reality is that there’s money to be made from cyclical trades for savvy investors who can time them well. But timing is notoriously difficult. It’s often the case that the process which follows the cyclical trade to the top is the same process that follows it back down.

Despite their headline-grabbing performance during boom times, most cyclical businesses aren’t great quality, and deliver average long-term sustainable returns. One of the problems with highly-capital intensive businesses is that they tend to deliver lower returns on capital. The easiest way to reduce return on capital is to increase capital expenditure. And increased capex is often funded with ballooning debt, which quickly becomes a millstone when things cool off. Add extreme valuations to the mix and you have all the ingredients for a major bust.

This doesn’t mean that AI isn’t going to be world-changing. It is. Probably even more so than the internet has been. But whether that translates into returns for investors is a different story. Just as the easiest way to reduce return on capital is to increase capex, so the easiest way to reduce return on your investments is to increase the price at which you invest. The next big winner probably isn’t the one you see in the rearview mirror. Cyclical trades come and go. Supply chokepoints tend to move as the cycle develops. Once insatiable demand can suddenly sour, and the catalysts usually come as a surprise.

Instead of chasing the cyclical trade for fear of missing out, it makes sense to position more defensively, favouring companies with consistent profitability, lighter capital structures, stronger balance sheets, and – importantly – reasonable valuations. These usually underperform their cyclical peers during the ‘boom’ phase, despite solid underlying business performance, but it’s exactly that which positions them to outperform in the phase which follows.

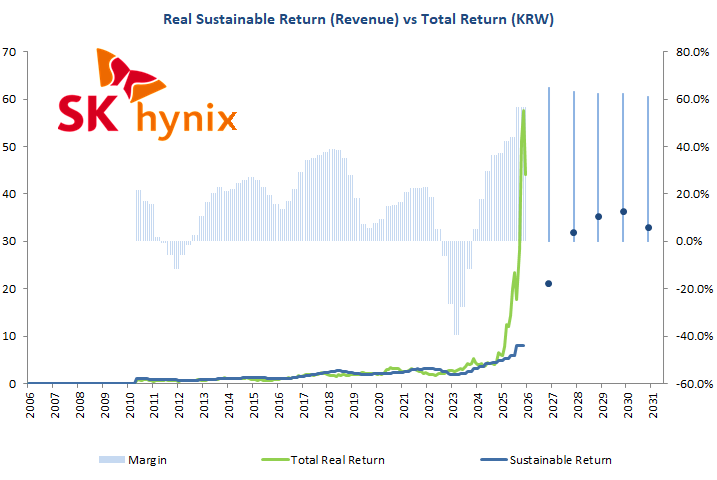
Let’s conclude with a visual. Here are a couple of graphs which show the recent 1 000% stock price rises (green lines) for Micron and SK Hynix – two poster children for the AI trade – in the context of their own history and fundamentals, with the current consensus forecasts for the next 5 years. The multi-trillion-dollar question: Is this AI supercycle sustainable?

SaaSportunity Knocks

One of the casualties of recent breakthroughs in agentic AI has been software stocks. The Morgan Stanley Software as a Service (SaaS) basket dropped 30% in the first quarter. It’s been dubbed ‘SaaSpocalypse’ by market commentators. The thesis is that agentic AI will fundamentally disrupt the SaaS business model and even replace the need for software. The resultant sell-off in software stocks has been deep and broad.

While AI will doubtless disrupt the SaaS business model, and probably even replace certain software applications, the ‘SaaSpocalypse’ narrative appears to be overly simplistic and perhaps too hastily applied to every company bearing the ‘software’ label. There are likely to be winners and losers within this space, but the market is currently pricing them all as losers. Our thinking is that this sell-off presents a rare opportunity to buy some of the highest quality businesses in the world, many of which are likely to benefit from AI, at cheap valuations.

Companies like Microsoft, Intuit and ServiceNow, which comprise the system of record upon which agentic AI operates, are available at decade-low valuations. Far from replacing these software tools, agentic AI may well increase the use of them. These companies are some of the most profitable and cash generative businesses in the world, with virtually no debt on their balance sheets. Where many see ‘SaaSpocalypse’, we see ‘SaaSportunity’.

Listen to Nvidia CEO Jensen Huang’s thoughts on this, which he shared on a recent CNBC interview with Becky Quick:


Good, Better… Emerging Markets

In 2024, we wrote an article entitled The Good, the Bad and the Emerging Markets in which we discussed the recent divergence between America, other developed markets and emerging markets. In the 3 years prior, the S&P 500 had returned 38%, developed markets 11% and emerging markets negative 17% – a massive spread of 55 percentage points. Back then emerging markets looked very ugly indeed. In fact, nothing outside of America looked great at the time – at least in the rearview mirror.

But a lot can change in a year. In 2025, the S&P 500 returned 18% in USD – very good. But developed markets and emerging markets were far better, both returning 34% in USD. This is the first time since 2017 that either of these have meaningfully outperformed the S&P 500, and only the second time since the 2009 financial crisis. As you’d expect, 2025 was a good year for us. We’re well underweight the US and overweight the rest of the world, mainly because that’s where we see the best opportunities, but also in anticipation of a normalization between America’s asset prices and the rest of the world.

If you arrange the ~50 stocks that we hold across all portfolios by USD return in 2025, only 1 in the top half was American: Alphabet (i.e. Google, our largest holding), which returned 66%. (Incidentally, this was also the best performer of the Magnificent Seven in 2025.) But it was our international exposure which really delivered. Apart from Google, some of the main contributors to portfolio returns were South American banks (up between 65% and 96%), Mexican airports (up between 43% and 66%), NetEase (+58% / China), ASML (+55% / Europe), Roche (+52% / Switzerland) and Tokyo Electron (+46% / Japan). There were several other smaller positions which also delivered very high returns – all of them from emerging/developed markets outside of the US.

So where does this leave us? Was 2025 the big reversal we’ve been waiting for? Not even close. The performance gap between US stocks and emerging markets has barely begun to close. You can hardly see the gap narrowing on a long-term graph. If this is the beginning of a big reversal, it will likely take several years to play out as has been the case with past reversals. It won’t be a smooth convergence. There will be ups and downs along the way. In fact, we can’t even be sure that this divergence has peaked yet. Who knows what 2026 will bring? But there’s good reason to believe that the US can’t outperform the rest of the world forever, both from a sustainable return perspective and especially from a valuation perspective. At some point it’s likely that this gap will narrow again, and we’re well positioned to take advantage when it does. 2025 just gave us a taste of what is possible if this gap narrows meaningfully.

Here’s that graph of the S&P 500 / MSCI Emerging Markets performance gap again, updated for 2025:


Facing Uncertainty

The MSCI AC World index declined 1.3% in USD in the 1st quarter of 2025, while the Rand strengthened 2.8% against the Dollar. Our own portfolios gained in the 1st quarter as the gap between US Megacaps and other international markets narrowed slightly. The real news however is what took place in the 1st week of the 2nd quarter where global stock markets fell 10% in the few days following the announcement of fresh tariffs from the US administration. The average ‘Magnificent Seven’ stock has declined 24% in 2025 (as of 7 April), more than double the global stock market. (Tesla has lost 42%.) The Rand also weakened 7.3% against the Dollar in the 1st week of April as concerns around local politics compounded the effect of international tensions.

So how should we respond to this sudden resurgence of market volatility? One approach would be to try and estimate the impact of tariffs on various countries, industries and businesses and then position accordingly. This approach is fraught given the inherent unpredictability of international tariff policies and their impact. The very nature of increased volatility is that it is associated with heightened uncertainty about the future.

Our preferred approach to facing uncertainty is to focus on robustness. A robust investment process is one that delivers satisfactory returns under a wide range of potential outcomes. What does this look like in practice?

1. Invest in fundamentally sound businesses, which are consistently profitable, cash generative and unencumbered by excessive debt. When fundamentals are tested by economic stress, these are the companies that will endure.

2. Avoid shares that are priced for perfection. During times of optimism, investors become accustomed to favorable outcomes and price stocks as though these outcomes are normal. They’re not normal. When outcomes inevitably disappoint, these stocks can face the steepest corrections.

3. Diversify your portfolio across different industries and geographic regions. This has always been a cornerstone of effective risk management. A portfolio focused on one specific niche is most at risk.

4. Don’t put yourself in a position where you become a forced seller of assets. This means having sufficient cash flow to meet near-term liabilities, as well as avoiding excessive financial leverage.

5. Remain disciplined. Don’t let market volatility derail you from your long-term financial plan. Resist the temptation to time the market. The investors who experience the most regret are those who sell out because of fear and fail to buy back again. The two reasons they fail to buy back again are: i) They got their timing wrong and they can’t stomach buying back at a higher price; ii) They got their timing right, but as the market continues to decline, fear is heightened rather than alleviated. The best time to buy is also the most uncomfortable time to do so. As Warren Buffett said, ‘Be fearful when others are greedy and greedy when others are fearful.’ This statement is true, but by its very truth also impossible for the majority to apply in practice. It’s much easier to predetermine a robust course of action and stick to it.

We’re committed to applying our investment process consistently in all market conditions. We’re also actively working through the potential opportunities presented by the recent market volatility to see where we can improve the quality and return profile of our portfolios.

What can we learn from a Century of Stock Market Returns?

Legendary investor Charlie Munger, famed for his role at the helm of Berkshire Hathaway alongside Warren Buffet, died at the age of 99 on 28 November 2023. He would’ve been 100 years old on New Year’s day.

The stock market experienced 5 major crashes during his lifetime, the Great Depression being by far the worst, during which the S&P 500 lost 80% of its value. He also lived through World War II and the Cold War, inflation and high interest rates in the 70s, the internet bubble, the housing bubble, numerous recessions, COVID-19, and so on. Think of some of the major events and crises that have taken place over the last century. Think of the newspapers, headlines, breaking stories, predictions, etc. Think of the advances made in technology, medicine and other fields. Think of how much has changed, even things we regard as being constant, like national borders… And that’s just the last 100 years. What might happen in the next 100?

The Lasting Impact

The investment world, especially the media, places a great deal of importance around daily happenings. Every day there’s a story important enough to make the front page, significant enough to cause many people to make major long-term investment decisions. These stories drive a lot of volatility in the stock market, which in the short-term is all we see. But over the long-term these stories come and go, and so does the volatility.

What really matters is profitability compounded year after year. $100 invested in the stock market (S&P 500) on Charlie Munger’s birthday – 1 January 1924 – would’ve grown to nearly $2.2 million dollars over his lifetime. A return of 10.5% per annum, despite all the craziness of world events during that time. That’s the lasting impact of the stock market over the last century.

The Next Century

It seems unlikely that the next century will be any less chaotic or more predictable than the last. The stories that dominate our thinking today will likely fade with the passage of time. But the discipline of investing in good businesses at good prices for the long-term is likely to leave a tangible impact that outlasts any of these stories. There will be plenty of volatility along the way, even a crash or two, but don’t let these things deter you from consistently doing the basics well. Don’t let the news sway you from your long-term investment plan.

“If you’re going to invest in stocks for the long term or real estate, of course there are going to be periods when there’s a lot of agony and other periods when there’s a boom. And I think you just have to learn to live through them. As Kipling said, treat those two imposters just the same. You have to deal with daylight and night. Does that bother you very much? No. Sometimes it’s night and sometimes it’s daylight. Sometimes it’s a boom. Sometimes it’s a bust. I believe in doing as well as you can and keep going as long as they let you.” — Charlie Munger (2021) 

Return-Free Risk

When you think of government bonds and their role in your investment portfolio, you typically think of stability. You invest in the stock market for high returns, but the bond market for stability. Bonds are there to ‘reduce the risk’ of your investment portfolio, and for that many are willing to accept lower returns. This paradigm has failed investors miserably in the last 3 years as interest rates globally have been hiked at record pace.

According to Bloomberg, US 10 Year Treasury Notes have crashed 46% since March 2020. That’s on par with the worst stock market crashes since the Great Depression! In the last century, US treasuries have never delivered more than 2 consecutive years of negative returns, and even then never of the magnitude witnessed since 2020. This truly is an historic market crash. What makes it even more incredible is that no-one outside of the investment industry seems to be talking about it. If it was the stock market or real estate it would be front-page news by now. I say this tongue-in-cheek, but it’s somewhat refreshing for an equity portfolio manager to watch a market crash from the sidelines.

Risk ≠ Return

There is an important lesson to be learned here. It doesn’t matter how high the quality of an asset is, how consistent the cash flows are, or how creditworthy the issuer may be – if the price you pay becomes completely detached from reality, then the asset becomes very risky. What’s worse is that this risk is associated with low returns, even under optimistic conditions. This stands in contradiction to the common (and inaccurate) mantra that risk = return. Higher business risk may typically be associated with higher potential returns, but the higher risk that comes from overpricing an asset is always associated with lower return.

Consider that in 2020, 10 Year Treasuries were yielding just 0.5% p.a. At that yield you’re not thinking about return, you’re all-in for downside protection. Ironic that 3 years later you’ve lost 46% with virtually no interest payments to cushion the blow, while the stock market (which you were fleeing) has climbed ~80%. One of the reasons Treasuries have never done so badly before, even though they’ve been through some extreme rate hiking scenarios, is that interest rates were already high enough in past hiking cycles to offset most of the capital losses. What you lost in capital you gained in interest. Not so when interest rates are close to zero. Can you see how this crash was built into the price?

Implications for the Stock Market

So what does this mean for the stock market? It’s not entirely clear since stocks are affected by many variables besides interest rates. Unlike bonds, future cash flows are not fixed. Higher inflation means higher revenues for companies, but it also means higher expenses, higher financing costs and, at least in theory, lower valuations. I say in theory, because it may also just mean that the relationship between bond yields and stock market earnings yields (the inverse of Price/Earnings Ratio) have finally normalized after more than a decade of being disconnected. We’re used to thinking of stock market valuations in terms of PE ratios and bonds in terms of yields. If I told you the S&P 500 would trade at a PE Ratio of 200x (more than 10 times historic norms), you’d think I was crazy, yet that’s the equivalent of what US Treasuries were doing in 2020. Just because bond yields have normalized from insane levels doesn’t automatically mean that stock market valuations must drop too.

We are beginning to see the effects of more than a decade of extremely loose monetary policy unwind. What has caught so many off-guard is how quickly loose monetary policy has unwound. We saw signs of the inevitable strain in the first quarter of 2023 with the US Regional Banking Crisis. Now we’re seeing it in the longer dated government bond markets across the developed world. Such a drastic change, to something as fundamental as interest rates, cannot take place without the ripple effects being felt throughout the global economy.

For us as equity portfolio managers, we continue to avoid over-indebted and over-valued stocks, which are most sensitive to fallout from higher interest rates. The biggest risks to be avoided in every kind of investment portfolio are always those that come from excessive leverage and extreme overpricing. Investors may have been willing to overlook these risks in zero-interest rate world, but we believe that’s likely to change.

‘Gradually, then suddenly.’

The biggest story of the 1st quarter was the collapse of Silicon Valley Bank (SVB) and the ensuing regional banking crisis in the US. It took just two days for SVB to collapse after the announcement that they needed to raise capital. Depositors lost confidence in the bank, triggering a run on deposits and cementing SVB’s fate. This followed news that crypto bank Silvergate was closing its doors. Then Signature Bank, roughly half the size of SVB, was also shut down by regulators that weekend. This sent shockwaves through the broader regional banking industry with the shares of banks like First Republic and Western Alliance down 90% and 60% respectively since then. Even the shares of financial services giant Charles Schwab have lost 35% in the wake of SVB’s closure.

So how did this happen? As Ernest Hemingway would say, ‘Gradually, then suddenly.’

‘Gradually…’

The seeds for the present regional banking crisis were already sown in the 2008 financial crisis. To prevent the technical insolvency of the banking industry, regulators changed an accounting rule which allowed banks to carry certain assets at their original book value instead of their prevailing (and much lower) market value. These assets were marked as ‘held-to-maturity’. The idea was that if the banks could hold these assets until they matured several years later, they would ultimately realize their book value, so they needn’t recognize the sizeable losses they were carrying in the meantime. This didn’t do anything to change the underlying reality of what those assets were worth at the time, but it did mean that the banks could satisfy regulatory requirements for capital adequacy without raising fresh capital. This accounting stroke of the pen apparently worked…

Fast forward to 2020 and the COVID/lockdown crisis. The US administration flooded the market with trillions of dollars of stimulus, resulting in a wave of new deposits for the banking institutions. Deposits held with Bank of America (by way of example) jumped from $700bn to $1.2tn between 2020 and 2021 – an increase of 70% in 1 year. What do you do with all this excess cash in a zero interest rate environment? Apparently you invest it in longer-dated ‘held-to-maturity’ securities with interest rates marginally above zero and pocket the difference. This is risky, since any increase in interest rates would decrease the value of those assets, only not on paper since they were marked ‘held-to-maturity’. This is what almost every US bank did with the wave of stimulus-driven deposits that came their way. Almost all of it was invested in longer-dated securities.

‘… then suddenly.’

The unprecedented stimulus, combined with global supply-chain upheaval in 2022, led to resurgent inflation and consequently the fastest interest rate hiking cycle for decades. When interest rates go from 0% to 4% in a year, something must give. The market value of these ‘held-to-maturity’ securities decreased by ~20% in some cases. If these losses were reflected on bank balance sheets, their equity would be severely impaired.

This brings us back to Silicon Valley Bank: Between 2020 and 2021, SVB’s deposit base more than doubled. Virtually all the new deposits were invested in longer-dated ‘held-to-maturity’ securities. In 2022, roughly 45% of their balance sheet was invested in these longer-dated assets (vs 20% in 2020). This is 2x-4x more than most other banks. Add to this that SVB had a very narrow deposit base, focused on the flagging tech startup space, and you have a recipe for collapse. As cash strapped tech startups began to withdraw deposits, SVB was forced to liquidate a portion of their ‘held-to-maturity’ assets at a sizeable loss to meet the withdrawals. This in turn impaired their capital, hence the need to raise new capital, which spooked depositors… and that was the end of SVB.

Finally…

While SVB was in the most precarious situation, there remains an underlying solvency issue with the overall US banking system. If every bank were suddenly forced to realize the losses on their ‘held-to-maturity’ assets, there would be serious implications. While regulators have managed to stem the immediate liquidity crisis (which exposes the underlying solvency issues), it remains to be seen whether time will take care of this problem or not. Either way, US banks have taken a big misstep which cannot simply be waved away because an accounting rule allows them not to reflect it in their financial reports.

In our portfolios we have limited exposure to the US banking sector. We are avoiding exposure to institutions with large ‘held-to-maturity’ exposures, even larger institutions such as Charles Schwab and Bank of America. Finally, when it comes to banks (and insurers) we avoid the smaller regional players since the largest players are usually better regulated and more diversified.

Dollar Relativity

It’s been a tough year for stock market investors. The MSCI World Index has returned -25.6% in 2022 (measured in USD), on track for its worst year since 2008 and its 2nd worst year since the index started in 1970. ‘Measured in USD’ is an important consideration though – more so than usual – as the Dollar Index has risen 17% YTD. This is one of the biggest and fastest changes in the Dollar Index over the last 30 years. (The Dollar index measures the USD’s performance relative to a basket of major currencies.) The Rand has lost 12% against the Dollar in 2022, less than the 17% change in the Dollar Index. In other words, the Rand has strengthened against most other currencies. The Euro has lost 14% in 2022, the Pound 17% and the Yen a massive 20%.

The following table shows the year-to-date performance of the MSCI World Index (the global stock market) measured in these major currencies and in ZAR.

MSCI World Index 2022
Currency USD EUR GBP JPY ZAR
YTD Return -25.6% -13.5% -9.6% -6.4% -15.6%
America vs the World

What in USD appears to be serious bear market, appears in most other currencies to be a ‘normal’ correction. How you perceive the current market movement has a lot to do with where you live and spend your money. If you’re in America, spending USD, then 2022 has been a bad year. If you’re in Japan, spending Yen, you’ve barely felt it.

The strengthening USD has been a trend since the financial crisis back in 2008. The following graph shows the performance of the MSCI World Index measured in different currencies, adjusting for the countries’ different inflation rates. This effectively measures how the market has performed relative to the cost of living in these countries.

There is a notable difference between the real USD return since 2008 and the real return measured in various international currencies. The difference between USD and EUR/GBP/JPY is far greater than the difference between ZAR and EUR/GBP/JPY. America has diverged from the rest of the world. What this means, in practical terms, is that the global stock market has done a lot less for Americans over the last 14 years than for people living in other countries, including South Africa. Relative to their cost of living, Americans have gained only 40% since 2008, while the British have gained 114%, the Europeans 138%, the Japanese 151% and South Africans 117%.

As South Africans we often think of the investment world in terms of domestic and offshore. This is a big mistake, in part because South Africa represents less than 1% of the world economy, but also because ‘offshore’ isn’t one big homogeneous basket as we so often imagine it to be. For starters there is a major distinction between the United States and the rest of the world. There is also a distinction between developed markets and emerging markets. The world is a big and diverse place.

So what can we take from this? 
  1. For international resident investors (including South Africans), the market movement in 2022 has been less severe than for American resident investors.
  2. We South Africans often measure ourselves in absolute terms relative to the USD, which paints a very bleak picture. While we do have severe domestic problems, if our currency were ranked on an international leaderboard (to borrow golfing terms), we’d be making the cut, not just in 2022 but even since 2008. There are bigger global forces at play than our local issues
  3. Key point: The global investment space is much bigger than America and the USD. ‘Offshore’ is not homogeneous. When you invest globally you are buying an internationally diversified portfolio with various underlying currencies, many of which are cheaper than the Rand. Don’t let one number – the USDZAR exchange rate – dominate your decision-making process when it comes to deciding whether to take money offshore. Consider the bigger picture.

Finally, we are constantly on the lookout for opportunities to invest in good businesses at attractive prices, wherever they may be. We’ve maintained significant USD cash balances throughout 2022. We’re well-positioned to take advantage of further market weakness. Far from being a disaster, the current market conditions are finally beginning to offer us a very welcome opportunity to deploy excess cash balances.

Effect and Cause

The MSCI World index lost 15.7% in the second quarter The ongoing conflict in Ukraine has continued to put pressure on global supply chains and commodity prices. US inflation increased to 8.6%, while the Federal Reserve rate increased from 0.5% to 1.75%. Consensus estimates are for a further 75bps increase at the end of July. There is also talk of a looming recession. So what do these indicators mean for the stock market? As investors, how should we respond to the economic data?

Should we time the market?

For many, the holy grail of investing is to find a reliable leading indicator for the stock market. Let’s say you had $ 10 000 to invest in 1970. Suppose you had a reliable indicator that could tell you in advance whether the stock market would earn a positive return or not in the following calendar year. Your strategy would simply be to hold either stocks or cash for that year depending on the indicator. If this was possible, then today (in 2022) your $ 10 000 would be worth nearly $ 7.3 million. If you’d simply held the stock index your $ 10 000 would be worth $ 800 000. That’s pretty good, but it’s only 1/9th of $ 7.3 million! You can see why the temptation to try and time the market, however futile that may be, is so powerful.

But suppose your indicator was not so accurate. What if it had you switching between stocks and cash a year late each time? Your $ 10 000 would be worth only $ 230 000. (The result would be very similar if you were a year early each time.) If you’re going to try to time the market, you need to be very accurate and herein lies the fatal flaw. An indicator that is a bit too early or a bit too late is worse than useless – it has negative value.

Economic data make poor market indicators

This is why economic data (GDP, unemployment, inflation, interest rates, etc.) are such poor stock market indicators. They’re always late. Yes, there is a causal relationship between the stock market and the economy, but the stock market reflects the expectations of investors looking at the future economic outlook rather than present conditions. The effect comes before the cause! The stock market is a leading indicator for the economy, instead of the other way around, even though the economy is the cause of the stock market’s returns.

A simple analogy is helpful: Roosters typically start to crow before the sun rises. Even though the rooster crows before the sunrise, it doesn’t cause the sun to rise. Instead the coming sunrise causes the rooster to crow. The effect comes before the cause. The rooster is a leading indicator for the sunrise, even though the sunrise is the cause.

Trying to time the stock market using economic indicators is like waiting for the sun to rise and then expecting the first rooster to crow. By the time the economic data comes, you’ve already missed the market move. The stock market is such a leading indicator that by the time expectations of future economic data have changed, you’ve already missed it.

What about other indicators?

So economic data are a no-go for market timing, but what about other indicators? Some clever analysts may run all kinds of back-tests to find indicators that would have been accurate (with hindsight), but the list of successful investors who have built their track records by consistently timing the market is a very short one. Back-tests and reality are worlds apart. The reality is that there simply isn’t a consistently accurate leading indicator that can tell you when the next stock market drop will happen. Despite this, not a year has passed since the last crisis that some prominent investor hasn’t predicted the next one. A broken clock tells the correct time twice a day, but that doesn’t make it useful.

There are however some useful indicators that can tell you whether long-term returns are likely to be high or low. But since even low long-term stock market returns are usually positive, it makes these indicators of little value for market timing. It doesn’t help being right about below average market returns for the next decade, but sitting in cash and earning an even lower return. Time is not your friend when you’re trying to time the stock market. If you’re a long-term investor the stock market is the place to be.

Time horizon vs. timing

The following table shows the history of returns for the global stock market since 1970. The first row of each block shows the annual return for that year. The second row shows the annualized return for the 7-year period ending in that year. While the 1-year returns are volatile and unpredictable, the long-term returns are more consistent. There hasn’t been a negative 7-year return* since the total return data for the MSCI World Index was tracked in 1970.

* Past performance is not an indication of future performance.

Invest in superior businesses through the cycle

So if these long-term indicators aren’t useful for market timing, or even for timing specific stock purchases, then what are they useful for? They can help us identify superior businesses that are priced for superior long-term returns. The strategy is to invest in these types of businesses over the long-term, through the unpredictable market cycle. This means we need to stomach the inevitable volatility along the way and not panic every time the market drops. Instead use these drops as an opportunity to add to your stock portfolio.

The list of successful investors who’ve built their track records this way is a much longer one. People like Warren Buffett spent little time trying to time the market or predict the economy, choosing instead to focus on business valuations, profitability and balance sheets. These are the same factors we focus on at Bellwood.

So what is the best approach to manage the market volatility? Don’t make investment decisions based on economic data. Follow a risk-based approach to asset allocation instead of trying to predict short-term returns and time the market. This means having enough cash and liquidity set aside to meet near-term and contingent liabilities and investing the rest in growth assets for the long-term, through the cycle.

Once you have this strategy in place, the most important thing is to maintain your discipline, especially when markets are falling. Emotional decisions are seldom good decisions. Don’t deviate from your financial plan. We won’t deviate from our investment process.

Inflation, Interest Rates and Stock Prices

One of the most significant changes to the economic landscape over the last year has been the return of inflation. The US inflation rate has risen to 7.9%, the highest reading in 40 years. US inflation has averaged roughly 2% for the last decade and 3% in the 20 years prior, peaking at 5% in 2008. It remains to be seen whether this spike in inflation is in fact ‘transitory’ or not. Many policymakers seem to be abandoning that view now.

Quantitative easing and sustained easy monetary policy have contributed to the potential for higher inflation for some time. But COVID-related supply chain issues and the Russian invasion of Ukraine are the two most immediate causes. The former has resulted in shortages of various goods and higher shipping costs. The latter has led to a spike in global commodity prices, including energy.

Inflation has a direct impact on what we pay for things. It also has a big impact on interest rates. Most central banks aim to curb inflation by raising interest rates. The theory is that when the economy runs too hot, interest rates can be raised in order to cool things down again, and vice versa. The problem is that interest rates are a bit of a blunt tool when it comes to controlling international supply-driven inflation – such as we are now seeing. Higher interest rates in America have little direct impact on the war in Ukraine or shipping from China. They may dampen domestic demand though.

Nevertheless, it seems likely that central banks around the world will respond with higher interest rates. This in turn will have other implications. Our primary concern is how higher inflation and higher interest rates are likely to impact stocks and other assets.

First, higher inflation means higher costs for companies.

However, since the global stock market represents the bulk of the global economy, it stands to reason that one company’s higher cost is another company’s higher revenue. In aggregate, the stock market tends to pass through the effects of inflation. There may be winners and losers depending on the nature of inflation. Good quality businesses are better able to pass through inflation effects.

Second, higher interest rates mean higher debt financing costs.

Companies which have a lot of debt are likely to come under pressure as interest costs mount. The impact of higher interest rates is not so easy to pass through as inflation. In a rising rate environment, overindebted companies will come under pressure.

The low interest rate environment that has prevailed since the ’08 financial crisis has spurred a wave of debt-funded stock buybacks. Companies have taken advantage of the low interest rates to raise debt at almost no cost. They’ve used the proceeds to indiscriminately buy their own shares on the stock market. This has the dual impact of increasing the leverage of these businesses, while simultaneously creating (artificial) demand for their shares. This pushes their share prices higher. It will be interesting to see the effect of this trade unwinding should interest rates start to bite. Not only will earnings come under pressure, but a major source of buying demand will disappear. Should they need to raise equity in order to pay down debt, the effect will be inverted, albeit in a less orderly fashion.

Finally, higher interest rates mean higher discount rates for assets.

When pricing an asset, expected future cash flows are discounted at a rate (the discount rate) to derive a value for that asset. The higher the discount rate, the lower the value of the asset. Central bank interest rates provide a reference point for all other discount rates. When interest rise, so do the discount rates for other assets, implying lower valuations.

The simplest way to demonstrate this is with a government bond. A bond has fixed cash flows on a predetermined schedule with a defined maturity date. This means that the only variable affecting the price of a bond is the discount rate. Higher interest rates => lower bond prices, and vice versa. For any given yield, you can calculate the bond price. As such, bond prices are usually quoted as a yield (which is the discount rate).

Stocks are a little more complicated. Their future cash flows are highly variable and they have no defined maturity date. This means that the discount rate is just one factor. At one time it may be a dominant factor, and at other times be overshadowed by other factors. All else equal, higher interest rates should lead to lower valuations for stocks, which generally means a lower PE ratio.

Interestingly, small changes in discount rates have the biggest impact on valuations when discount rates are very low (i.e. valuations are very high). This makes highly valued assets more sensitive to changes in discount rates than cheaper assets. (This effect is referred to as ‘convexity’ in fixed income management.)

History shows the relationship between inflation and asset valuations.

Since interest rates tend to follow inflation rates, we’d expect to see an inverse relationship between PE ratios and inflation rates over long periods of time. The last 70 years of stock market history demonstrate a weak inverse relationship between the S&P 500’s PE ratio and US inflation. This weak relationship became a lot stronger during the ‘70s and early ‘80s when high inflation was a major factor.

Source: Bellwood Capital, Bloomberg.

Inflation also impacts other assets.

As we already alluded to, bonds are highly susceptible to inflation. This is because they have no mechanism for adjusting the predetermined cash flows to reflect increased inflation. Should we enter a sustained period of high inflation, bond returns are likely to be poor as interest rates rise and bond prices fall.

Property is somewhat similar to the stock market, but since debt-funding is more prevalent, interest rates tend to have a greater impact.

Inflation obviously erodes the value of cash, although higher interest rates tend to compensate for this. (Unless your cash is under your mattress.)

Gold is considered to be an inflation hedge, but with a lot of volatlity (much like other commodities). Over long-periods of time however, gold fails to match the returns offered by productive assets.

There are several implications for equity investors.

Although high inflation is not a good thing for stocks, stocks remain the best long-term inflation hedge. This is because of their ability to pass through inflation over time. The best ways to mitigate the impact of high inflation on your investment holdings are to:

  1. Maintain a reasonably diversified portfolio of high quality businesses, which can pass through the cost pressures of high inflation;
  2. Avoid over-indebted companies, which may become distressed as a result of higher interest rates;
  3. Avoid over-valued stocks where small changes in discount rates will have the greatest impact on valuations.

These three points really sum up our investment process: Acquire and maintain a diversified portfolio of profitable businesses with strong balance sheets at attractive prices.

Remember, inflation is notoriously difficult to predict. We don’t know if we’re headed for a repeat of the ‘70s/’80s, but we can and should always follow a robust investment philosophy and process.